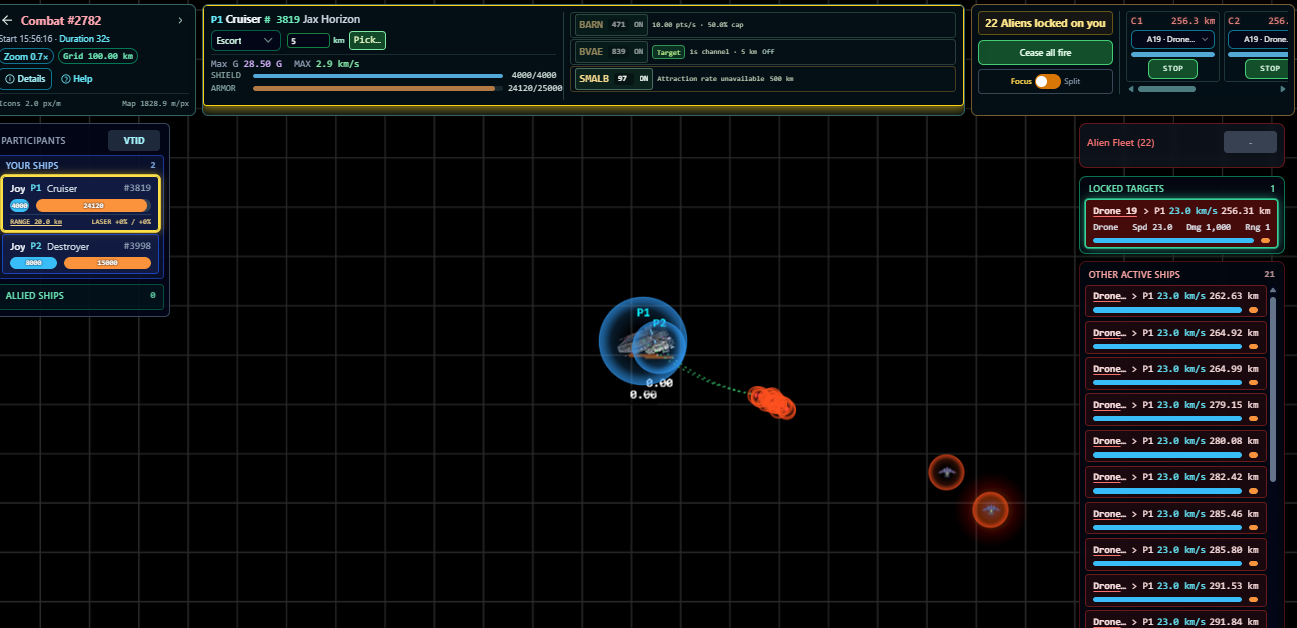
Zero-G is a free browser MMO built on a 1:1 scale Solar System. Node.js and WebSockets on the server, no download, no client, no install — you open a tab and you are flying. In October we pushed the combat engine past a hundred ships in a single engagement, and then to 150: a number we had been describing publicly as "hundreds" without ever having measured it honestly.
It did not survive contact. This is what broke, what we guessed wrong, what the instruments said, and what is still not fixed.
The symptom
On 8 October, a simulation of 7 human ships against 91 alien drones restarted the server five times in seven minutes.
07:15:56  restarted because it exceeds --max-memory-restart (current_memory=1091022848)
07:17:26  restarted because it exceeds --max-memory-restart (current_memory=1213882368)
07:18:56  restarted because it exceeds --max-memory-restart (current_memory=1167020032)
07:20:56  restarted because it exceeds --max-memory-restart (current_memory=1164460032)
07:22:26  restarted because it exceeds --max-memory-restart (current_memory=1173512192)
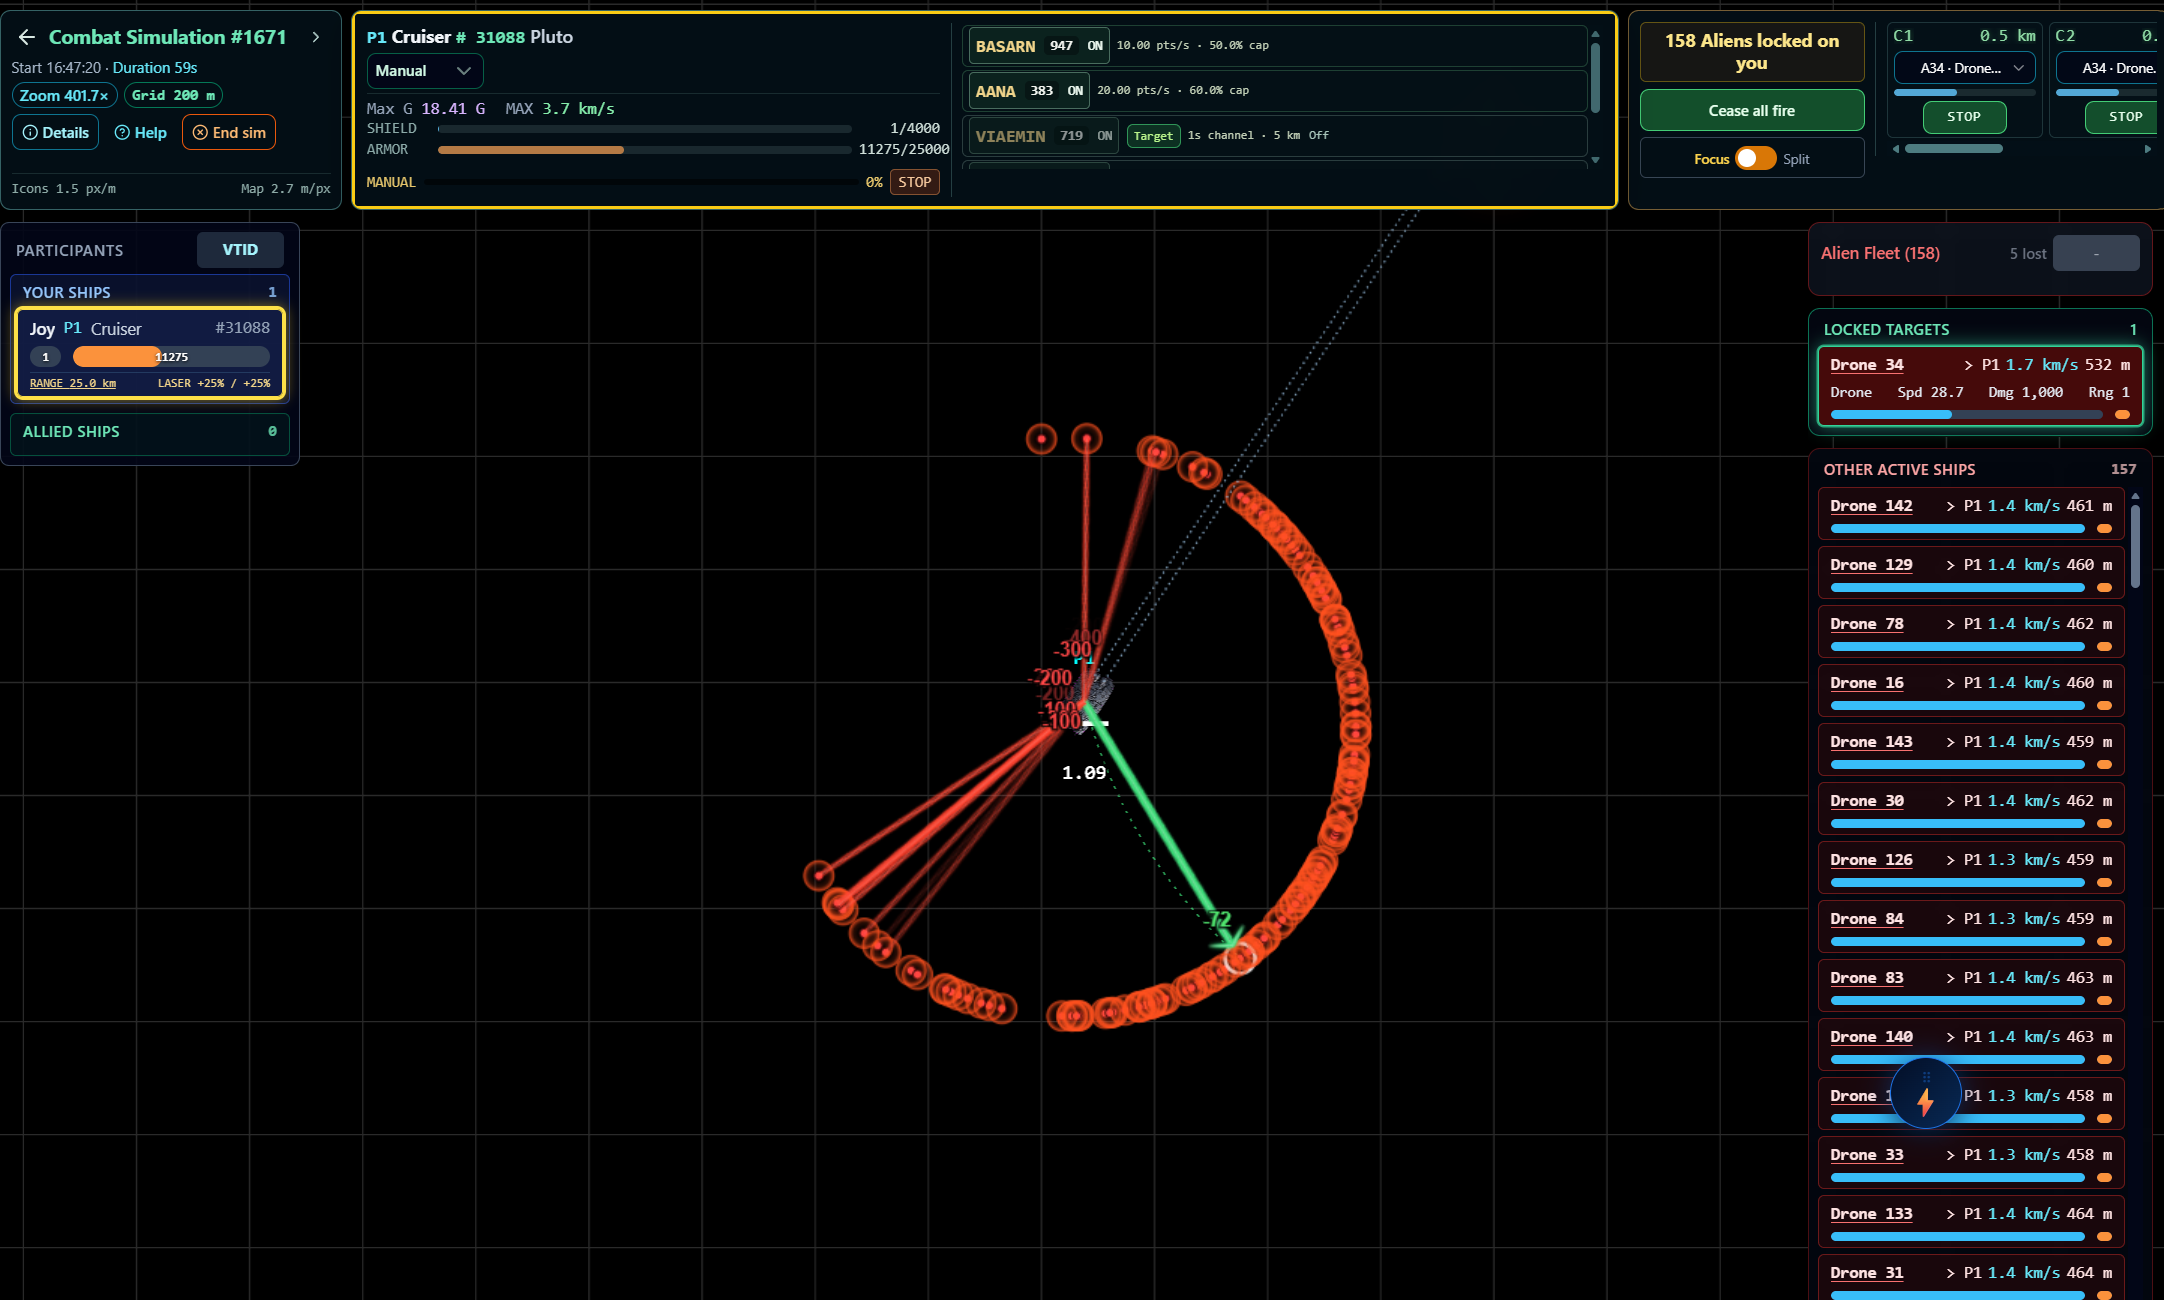
The process is capped at 1 GB under PM2. Under a hundred-ship engagement it reached that ceiling in 60 to 100 seconds — in three of the four engagements we logged that day, at 98 to 104 ships apiece.
The fourth is the interesting one. It had 95 aliens against a single human ship, and it did not crash: the human was destroyed at 55 seconds and the fight ended before the ceiling could be reached. The alien count was never the thing that mattered. What mattered was how long the broadcast ran.
Meanwhile the error log was reporting something that should not have been possible:
[PERF-ALERT] Unified Broadcast Tick took 5990.29ms
[PERF-ALERT] Unified Broadcast Tick took 6151.54ms
[PERF-ALERT] Unified Broadcast Tick took 6928.11ms
A loop scheduled to run once per second was taking seven seconds to resolve.
Before the bugs: what our own diagnosis got wrong
We wrote the analysis before we wrote the fix, and when it was turned into an implementation plan the first casualty was our own confidence. This is worth putting before the technical content, because most of what we were sure about turned out to be arithmetic rather than evidence.
We treated throughput as if it were memory. We measured a payload at roughly 141 KB, multiplied by 20 Hz and seven connected clients, arrived at 19.7 MB/s, and started reasoning as though that figure described something sitting in the heap. It does not. Cumulative bytes transmitted are not retained bytes, and the distinction is the entire question.
We described the retention mechanism as though we had observed it. We had inferred it. The PM2 log proves a memory-threshold restart. It does not prove a V8 heap-limit exception, and it does not identify which allocation path was responsible.
We got the serialisation arithmetic wrong. We claimed that serialising once instead of once per recipient would take 140 calls per second down to two or three. It takes it down to twenty — one per broadcast rather than one per broadcast per client. Getting to two or three is a different change entirely, and we did not make it.
And two of our "contributing causes" were simply false. We proposed disabling the detailed event buffer during simulations because "a hundred ships at 20 Hz produce hundreds of shots per second". They do not — weapon fire is governed by gun count and rate of fire, not by physics ticks. We proposed skipping the armour checkpoint because 100+ sequential awaits every 30 seconds were blocking tick scheduling. They were not — the checkpoint is launched without being awaited inside the tick.
Both remain candidates if measurement ever says they matter. Neither is a candidate for the reason we originally gave.
Four faults, stacked
What we eventually found was not one bug. It was four, and each was comfortably hidden behind the next.
1. The tick rate was double what the source said
DEFAULT_CONFIG.TICK_RATE_MS is 100 ms. Every conversation we had about combat performance assumed 10 Hz, because that is what the code says.
The active configuration is not in the code. It is loaded from the database, from combat_parameters.tick_rate_ms, and in production that value was 50 ms. The engine was configured at 20 Hz, twice the rate anyone in the room believed.
We found it by querying the production database. No amount of reading the source would have revealed it, because the source was not lying — it was simply not the thing in charge.
Two caveats we have since learned to attach. The configured rate and the achieved rate under load are different numbers, and we had been using them interchangeably. And a value read once off a production console by a human is evidence, not a measurement; it belongs in the diagnostics output, which is where it now lives.
2. Simulations were broadcast to everyone
const broadcastToAll = type !== 'combat_start'
  && !!combatEngine.getCombatState(combatData.combatId)?.instance.isSimulation;
In a real battle, combat updates go only to the pilots taking part. For simulations, this line sent every frame to every authenticated client connected to the server — people on the Solar System map, people in a mining screen, people who had left a tab open and gone to lunch.
3. We serialised the same object once per recipient
wss.clients.forEach((client: WebSocketClient) => {
  if (client.readyState === WebSocket.OPEN && client.userId) {
    if (broadcastToAll || participantUserIds.includes(client.userId)) {
      client.send(JSON.stringify(message));
    }
  }
});
JSON.stringify is inside the loop. At 20 Hz with seven connected clients that is 140 serialisations per second of the same object — an object we estimated at around 141 KB, because 104 ships were being described with roughly 45 fields each.
About 35 of those 45 fields never changed: iconFile, pilotName, shipClassName, guns, length. We were transmitting a ship's icon filename twenty times a second to people who were not watching the battle.
4. Nothing checked whether anyone could receive it
There was no check on client.bufferedAmount anywhere in the send path. A client on a slow link, or in a background tab the browser has throttled, cannot drain megabytes per second — and ws does the only thing it can, which is to queue the unsent frames.
This is our leading hypothesis for the retention, stated as a hypothesis. What is not in doubt is that the check was absent, which is a defect whatever else turns out to be true.
And the recovery recreated the crash
PM2 restarted the process. On boot, initializeFromDatabase() restores any active combat from the database — correct behaviour, and exactly what you want when a server dies mid-fight.
The hundred-alien simulation came straight back, resumed ticking at 20 Hz, resumed broadcasting to everybody, and hit the ceiling again a minute or so later.
What we changed
Four things shipped.
Server-authorised viewing subscriptions. Combat frames now go to authenticated participants and to clients that have actually opened that fight — not to everyone. The subscription is backed by a verified session rather than a client-supplied user id, and it has to survive route changes, multiple tabs, reconnects and stale cleanup. Lightweight lifecycle notices — a simulation starting, a simulation ending — stay global, because those are cheap and everybody wants them.
Serialise once, after recipient selection. 140 calls per second down to 20.
Bounded send queues with snapshot coalescing. Rather than letting a slow socket accumulate frames, obsolete snapshots are collapsed: a viewer who cannot keep up gets the current state, not a backlog of stale ones. A persistently congested socket is closed with an explicit resynchronisation. The constraint that mattered here was not to silently drop terminal events — a lost position frame costs nothing, a lost "combat finished" message strands a player.
We deliberately did not adopt a flat 64 KB high-water mark. A fixed watermark chosen without reference to actual frame sizes is a number that looks principled and is arbitrary.
A single-flight unified broadcaster. If a cycle is still running when the next interval fires, the interval is skipped rather than queued, and after a slow cycle it resumes with current data instead of working through everything it missed.
And an explicit static/dynamic wire contract, so the invariant metadata goes once on entry and on resync, and the periodic update carries only mutable state, merged by stable id into a baseline the client already holds. We did not adopt the tidy ten-field update our own analysis proposed, or promise a sub-20 KB payload. The field list has to be every field some existing consumer actually reads, and the size is something to measure afterwards.
The fix we did not make, and why
The obvious remedy was to throttle the broadcast to every eighth tick — 2.5 Hz at a 50 ms tick, an 87% cut in packet rate, one line of code.
We did not do it.
The renderer applies received ship positions directly. There is orientation smoothing, but that is not the same as interpolating whole-fleet positions between frames, and assuming it was would have been easy, because we do have interpolation elsewhere in the codebase. At 2.5 Hz the fleet would have moved in visible steps.
Worse, the engine clears pending weapon-fire deltas every tick. A modulo gate on the broadcast would not have delayed those shots — it would have discarded seven out of every eight of them. The battle would have looked quieter and nobody would have been able to say why.
The cadence change is deferred, not rejected. It needs a real design for position presentation and bounded event delivery, not a % 8.
What the measurements say
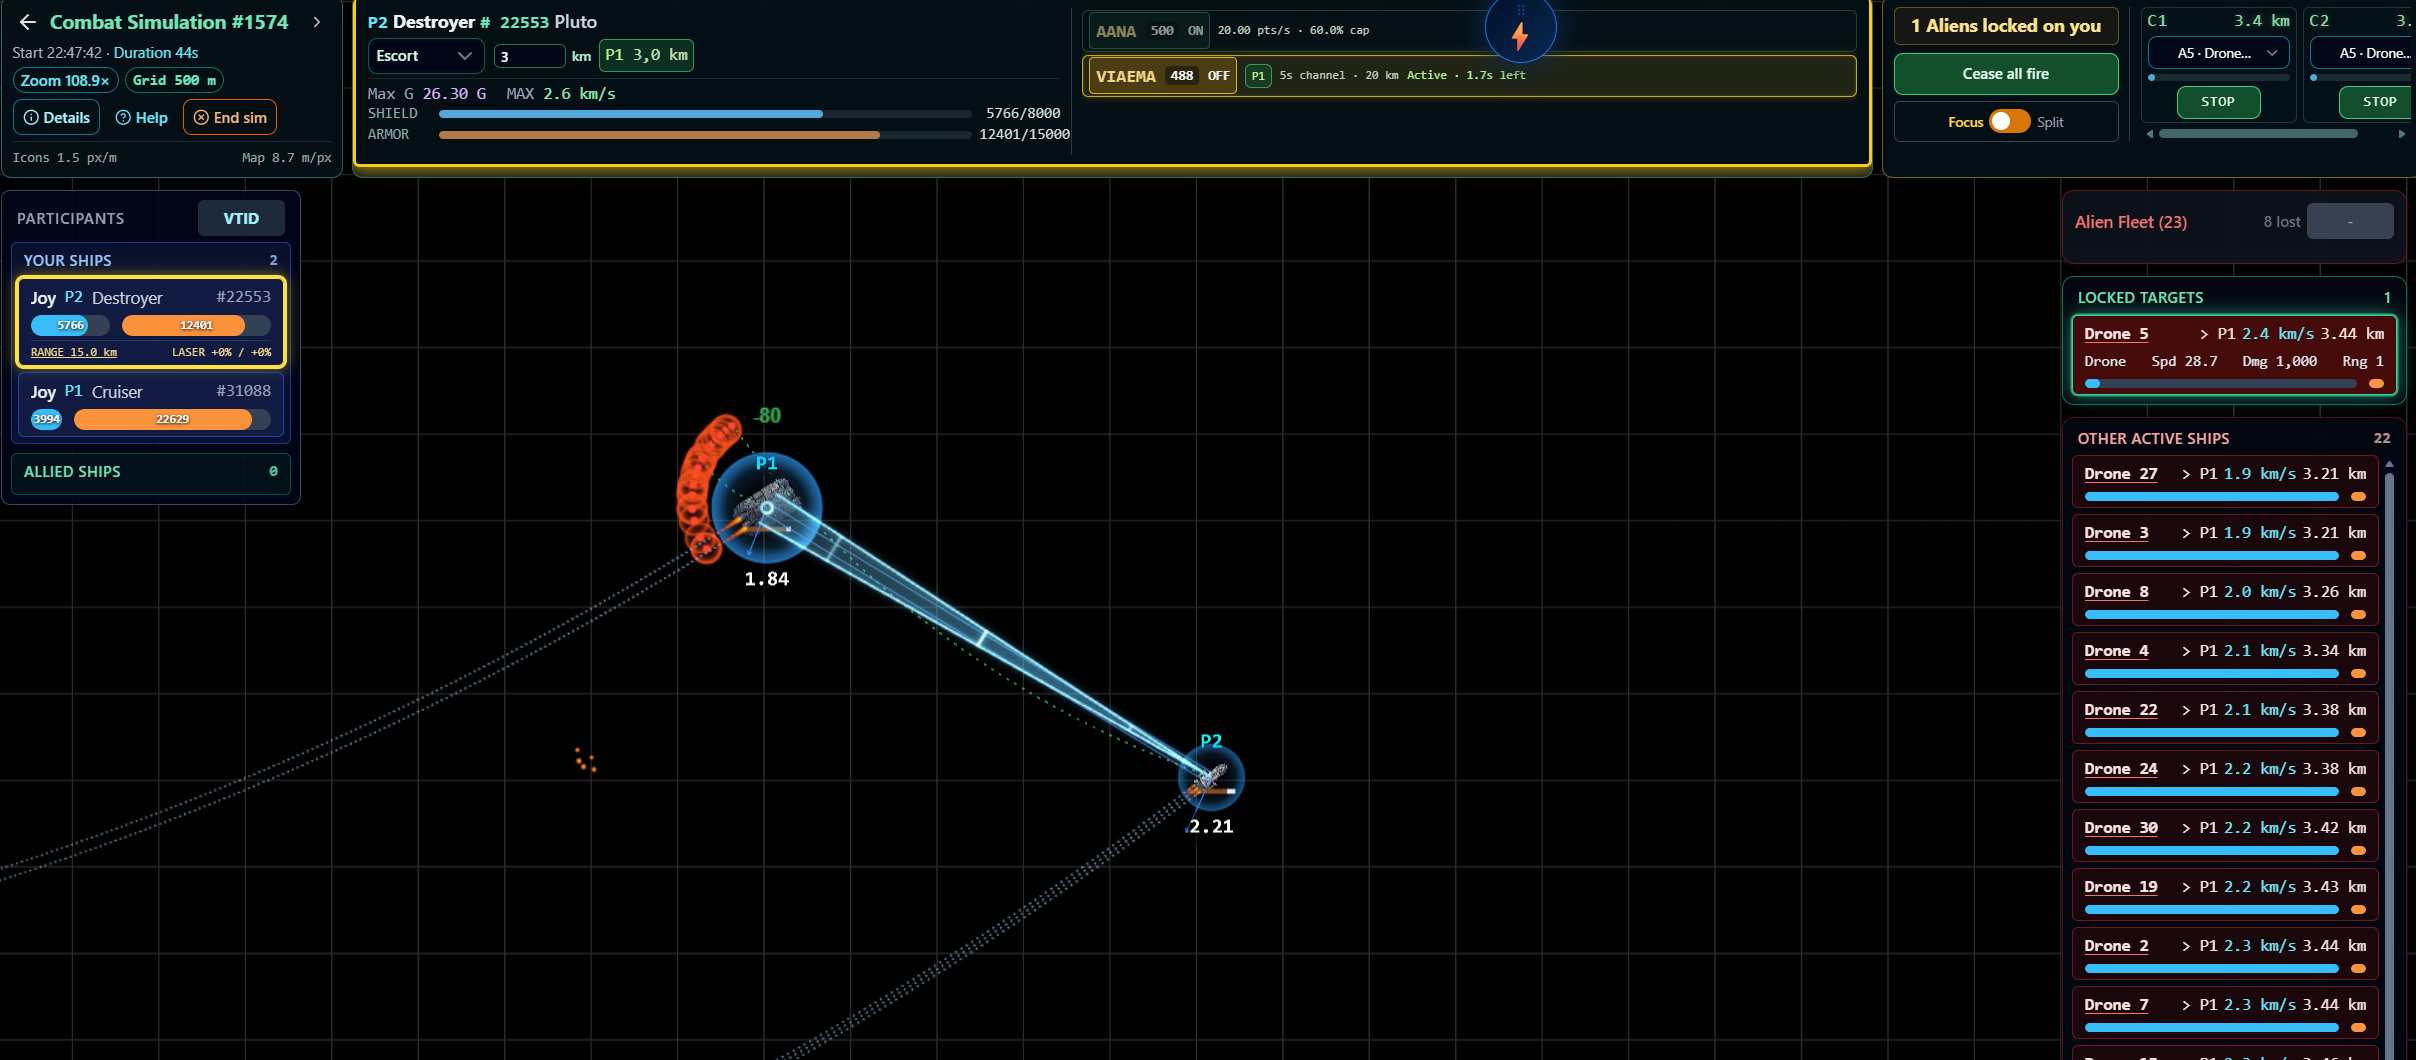
Conditions, stated plainly: these are from a test host, not production. Engagements of 115 to 150 ships, overwhelmingly alien, with about ten clients connected — most of them not watching the fight, which is the case that broke it before. PM2 cap left at 1 GB. Sampled every five seconds from outside the process: pm2 jlist for RSS and restart count, ss -tnH state established for per-socket send queues. No application code was modified to take these readings.
| Before (8 Oct, production) | After (23 Oct, test host) | |
|---|---|---|
| Ships | 98–104 | 115–150 |
| Connected clients | 7 | ~10 |
| Restarts during the run | 3–5 | 0 |
| Longest survival | ~101 s | full run, every run |
| RSS | climbed to the 1 GB cap | oscillated 644–851 MiB |
| Combat tick | not measured | 2–7 ms, no slow-tick alerts |
| Peak single-socket send queue | not measured | 3.99 MiB |
| Peak aggregate queued | not measured | 8.94 MiB |
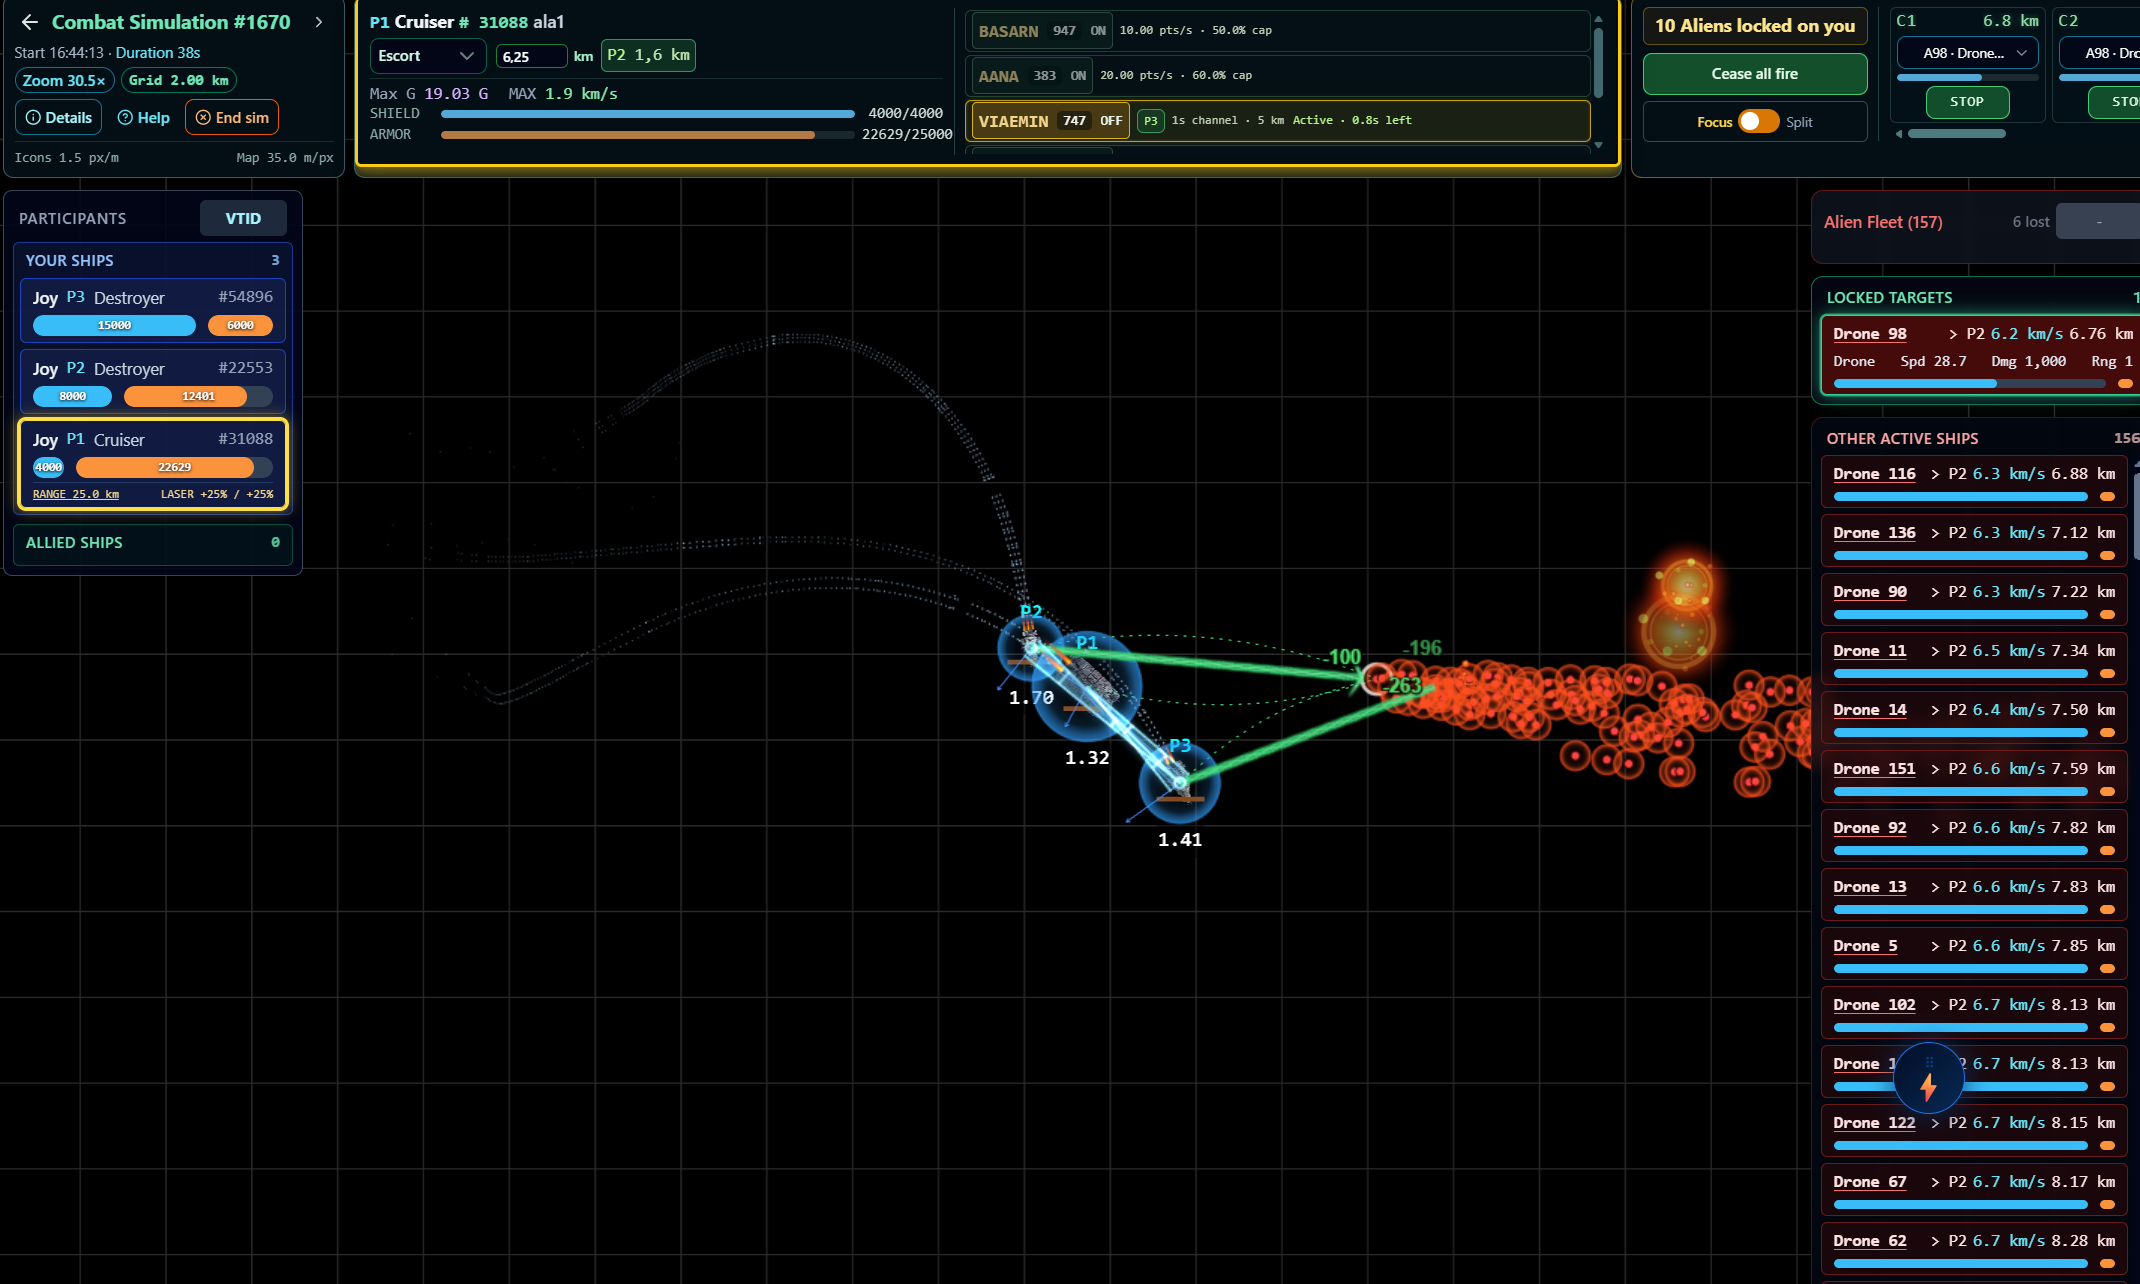
Three runs, 160 to 238 seconds each, including one of repeated back-to-back engagements.
On memory, the honest version. RSS does not climb monotonically any more; it sawtooths between roughly 644 and 851 MiB and keeps coming back down. Across the back-to-back run the mean per quarter rises — 705.7 / 736.1 / 732.2 / 751.7 MiB — but the minimum per quarter is the better leak indicator, and that reads 643.8 / 689.9 / 673.9 / 687.6: a step up during warm-up, then flat.
That is consistent with a bounded process. It is not proof of one. Four minutes cannot tell you what happens over four hours, and we are not going to claim otherwise.
One table we did not build. We are not putting the combat tick next to the old broadcast figure. The 5,990–6,928 ms readings were the unified broadcast cycle; the 2–7 ms readings are the combat tick. Different loops. Comparing them would produce a spectacular-looking number and would mean nothing.
The thing we were not looking for
The send-queue sampling found something we had not gone looking for, and it is the most useful result of the exercise.
During a fight, client send queues cluster at two distinct ceilings:
- 36 samples between 177 KB and 223 KB
- 44 samples between 2.5 MB and 4.17 MB
Those are not arbitrary. On this host:
net.ipv4.tcp_wmem = 4096   16384   4194304
net.core.wmem_max = 212992
212,992 bytes and 4,194,304 bytes. Some client sockets set SO_SNDBUF explicitly and are therefore capped by wmem_max at 208 KB; the rest use TCP auto-tuning, which ignores wmem_max entirely and scales to the tcp_wmem maximum of 4 MiB. Same application, same battle, a twentyfold difference in how far behind a viewer can fall — and nothing in our code chose it.
The consequence matters more than the trivia. Our backpressure guard watches ws.bufferedAmount, which is ws's own queue. Underneath it sits a kernel buffer that will absorb up to 4 MiB first.
The guard is not wrong. It is downstream of a cushion large enough to hide the condition it exists to detect. If you have added a bufferedAmount check to a high-rate WebSocket server and considered the problem solved, this is worth ten minutes of your time with ss.
What is still not solved
The broadcast cadence is still 20 Hz. The real fix for packet rate is the one described above that we deferred, and until it is designed properly the serialisation win is 140→20, not 140→2.
The guard cannot see past the kernel buffer. Described above, and currently unaddressed.
And the crash loop is still there, above a certain size. We know this because we found the next ceiling by accident, while writing this article: somebody created a battle with fifteen thousand drones by mistake.
The process died. It came back, initializeFromDatabase() faithfully restored the fifteen-thousand-drone engagement, and it died again. Recovery meant stopping PM2 entirely and cancelling the simulation by hand in SQL, because nothing in the running system could get far enough to be told to stop.
A small bonus discovery from doing that under pressure: combat_instances.id and combat_sim_instances.combat_id do not share a type in production, so the cancelling UPDATE needed ::text casts on both sides of the join. You find out about your schema at the worst possible moment.
So: it holds at 150, it dies at 15,000, and restore-on-boot is still a one-way trap if a fight is big enough to kill the process. We would rather publish that than a clean number.
What we would tell someone starting this
Two of the four faults were invisible in the source code. The tick rate lived in a database column. The memory growth lived in a module we did not write, queueing frames for clients we were not thinking about. The profiler showed a slow broadcast loop, which was true and was also a symptom.
What actually found it was correlating two logs nobody had put side by side — PM2's restart timestamps against our own simulation lifecycle log — and then measuring from outside the process rather than asking the process about itself. Every number in the "after" column above came from pm2 jlist, ss and sysctl. We did not have to modify the application to learn any of it, which meant we could run it against a live system without the instrument changing what it measured.
Before you optimise the thing that looks slow, find out who you are sending it to — and check whether the buffer you are watching is the only buffer in the path.